
Even though the crypto market rebounded 11% from the Nov. 9 low, a few metrics suggest investors are still fearful.
Between Nov. 8 and Nov. 10, the cryptocurrency market capitalization decreased by 24% to $770 billion. A 16% recovery followed after the immediate panic subsided and futures liquidations stopped pressuring asset prices.

Drop in Crypto Market Cap
As the market dropped below $850 billion market capitalization this week, it was not the market’s first dip below that level; similar dips also occurred in June and July. On Nov. 9, $770 billion was the lowest intraday bottom since December 2020, but support displayed strength in both cases.
Bitcoin’s 18.3% loss and Ether’s 22.6% price decline contributed the most to the 17.6% drop in total market capitalization. Despite this, altcoins suffered the most, with 8 of the top 80 falling by at least 30% during the period.
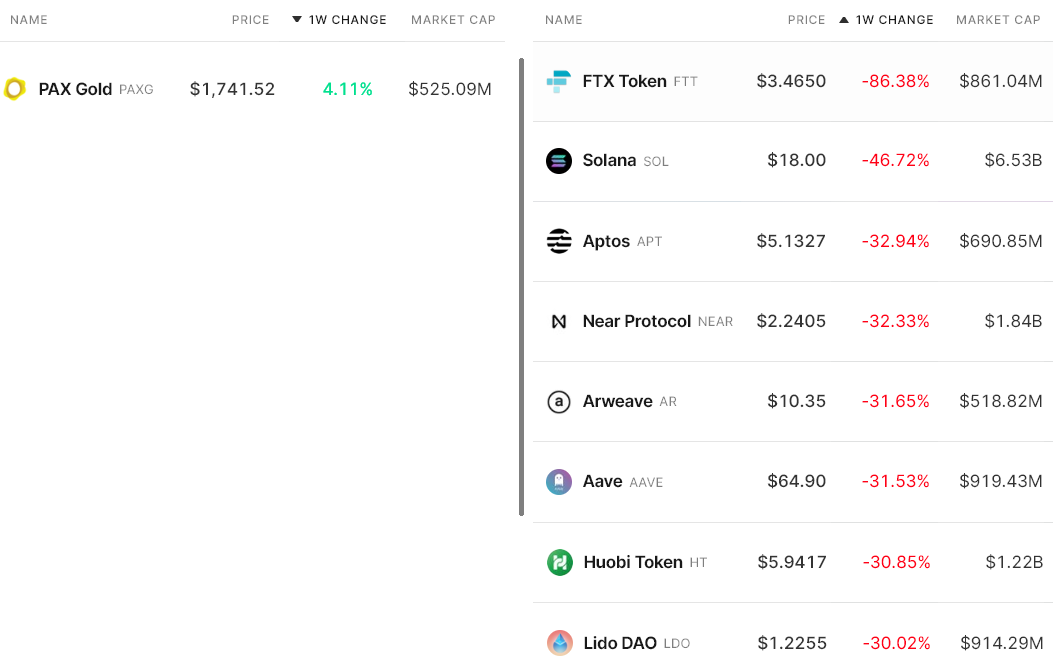
As a result of the insolvency of Alameda Research and the FTX exchange, FTX Token and Solana were severely affected by liquidation.
After clearing the air of rumors that FTX was holding Aptos Foundation or Aptos Lab’s treasures, Aptos (APT) shares dropped 33%.
The Demand for Stablecoins in Asia Remained Neutral
China-based crypto retail trader demand can be gauged by the USD Coin premium. Peer-to-peer transactions in China are measured against the dollar.
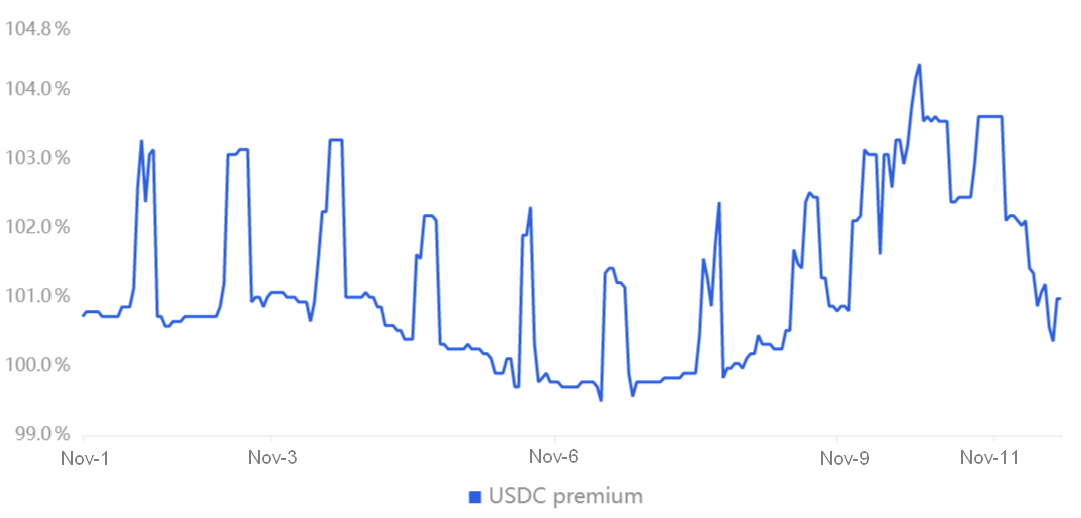
According to the USDC premium, it is currently trading at 100.8%, the same as last week. Asian retail investors did not panic sell despite a 24% drop in crypto market capitalization.
The USDC buying pressure, however, should not be interpreted as bullish, as it indicates traders are looking for shelter in stablecoins.
Futures Markets Are Not Used Much by Leveraged Buyers
It is typically charged every eight hours for perpetual contracts, also referred to as inverse swaps. To prevent exchange rate imbalances, exchanges charge this fee.
Investors who demand more leverage have a positive funding rate. In contrast, negative funding rates are caused by shorts (sellers) who require more leverage.

For the two largest cryptocurrencies, the 7-day funding rate is slightly negative and data indicates that shorts (sellers) are in oversupply. The cost of maintaining open positions is 0.40% per week, but it is not concerning.
Also, traders need to evaluate the options market to find out whether whales and arbitrage desks are betting more on bearish or bullish strategies.
Put/call Ratios Indicate Deteriorating Sentiment
Trading activity through call (buy) or put (sell) options can give traders a sense of the overall sentiment of the market. Bullish strategies typically use call options, whereas bearish strategies use put options.

An open interest ratio of 0.70 signifies that put options are more bullish than calls by 30%. Bearishness can be deemed when an indicator of 1.20 shows a 20% favorable sentiment toward put options.
Investors rushed to seek downside protection after Bitcoin’s price dropped below $18,500 on Nov. 8. This resulted in an increase in put-to-call ratios to 0.65. However, the current 0.63 level indicates that neutral-to-bearish strategies dominate the Bitcoin options market.
When combined with skewed perpetual contract premiums and the absence of stablecoin demand in Asia, traders become less confident that the $850 billion market capitalization support will endure shortly.