
Charts serve as a technical trader’s window into the markets. With so many advancements in analysis platforms, traders can now access a vast array of market data. However, with so much data available, it’s critical to build well-designed charts that will aid, rather than impede, your market study. The faster you can analyze market data, the quicker you can respond to shifting conditions. Taking the time to create tidy, easy-to-read tradingview charts will help you increase your situational awareness and ability to analyze market activity.
Investors frequently use four types of trading charts to understand activity in the forex market and other trading markets: daily, intraday, monthly, and weekly. The many sorts of trading charts depict a variety of price movement expressions across time. Looking at these trading charts enables investors to evaluate and understand price movement in ways only feasible by reviewing chart data. You will note that changing your time horizon can substantially alter your perception of a particular currency or market. This article will look at the most frequent trading charts used to track market action.
Understanding Forex and Crypto Charts:
Trendlines
Because price trends are discovered using a sequence of lines or curves, understanding trendlines and knowing how to draw them is beneficial. Trendlines assist technical analysts in identifying regions of support and resistance on a price chart. Trendlines are straight lines that connect a succession of descending peaks or ascending troughs on a graph. A trendline that angles up, also known as an up trendline, happens when prices experience higher highs and lower lows. The rising lows are connected to form the up trendline. A trendline that is inclined down, known as a down trendline, happens when prices have lower highs and lower lows.
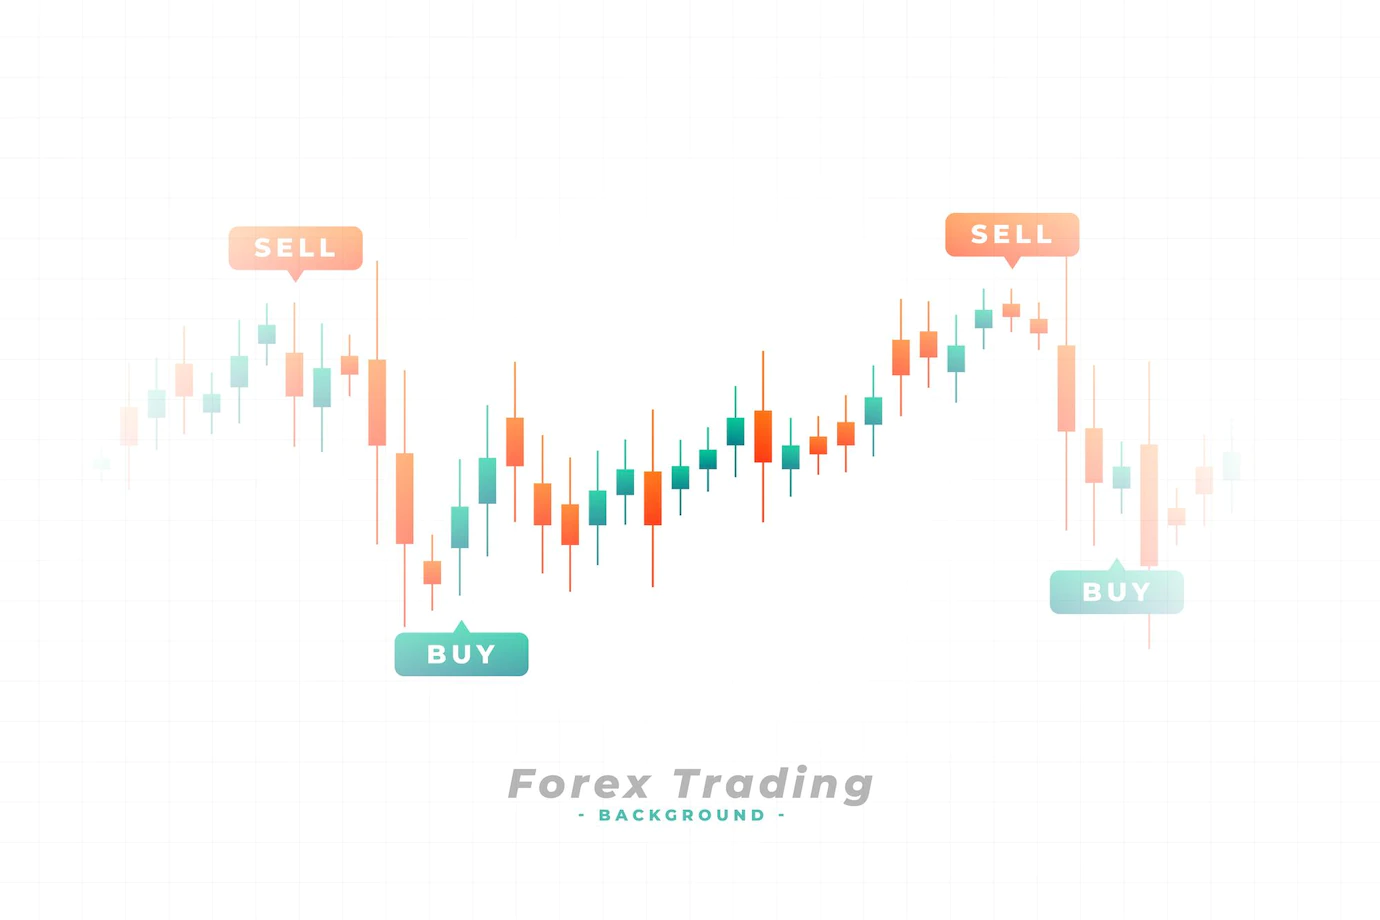
Channels are another item to check for. Channels are made up of two parallel trend lines with prices bouncing back and forth between them. The traditional technique is to sell at the channel’s top and buy at the bottom. Traders typically seek patterns in the trend that generate trading opportunities. Channels give a background for identifying high-probability patterns. Traders may sell off the channel’s top or buy off the bottom, regardless of trend direction. When a pattern converges with a trend line, the likelihood of a profitable trading opportunity improves significantly.
Patterns
A chart pattern is a shape within a price chart that helps to predict what prices will do next based on prior performance. Chart patterns are the foundation of technical analysis, and necessitate a trader’s understanding of what they are looking at and what they are looking for. Here are a few to watch out for:
Logarithmic – A logarithmic trendline is a best-fit curving line that is most effective when the rate of change in the data rapidly increases or drops and then levels off. A logarithmic trendline can contain both negative and positive numbers.
Polynomial – Polynomial trending refers to a curved data pattern that deviates from a straight linear trend. It frequently occurs in a vast set of data with multiple swings. As more data becomes available, linear patterns become less common, and polynomial trends take their place. As a result, graphs typically show polynomial trends with curved trend lines.
Power – The power trendline resembles the exponential curve but has a more symmetrical arc. It is frequently used to plot measurements that increase at a constant rate. An Excel chart with zero or negative numbers cannot have a power trendline added to it.
Exponential – When data values increase or drop exponentially or at a progressively higher or lower pace, use an exponential trendline. For example, an exponential trendline could be used if your chart shows an exponential increase in sales by product line over time.
To Conclude
Identifying trends, whether they are moving up, down, or across the board, and knowing when they are likely to reverse, is critical to your success. You must be able to follow charts regardless of the asset you are trading. The ability to read trading charts is an essential component of trading, and the more you learn about it, the better a trader you will become. Like anything else, the more you practice, the more your skills will improve. This post will help you get started on your quest to learn and use charts to enhance your forex and crypto trading.