

Despite the current drawdown bitcoin is likely to rebound and reach $65,000 in coming weeks. If it rebounds above $63,100 investor sentiment towards the asset may improve. Although bitcoin retested $59,000 in recent days, its rebound above $60,000 has helped to keep a positive sentiment among the investors. Several factors are currently impacting the crypto market in general. For example, the rising geopolitical tension in the Middle East has generated much uncertainty among the investors.
Recently, Santiment has indicated that bitcoin may reach a local top. Posting on X Santiment said, “Expect some testing of bulls’ patience as sentiment has crossed into high FOMO (greedy) levels. This typically coincides with upcoming local tops. They may happen today, this weekend, or in the upcoming weeks, depending on how whales behave at these levels. That said, don’t expect to be able to re-buy at $50K or $60K without world economies beginning to show red flags of their own.”
Considering the above forecast the recent bitcoin correction may be a result of a short-term market top. If this price fall is only temporary bitcoin may soon surge again. In fact, there are some indications that bitcoin still maintains its bullishness despite the bearish cues. Let’s look at a few of the bullish indications.
The Bullish Indications
Bitcoin Net Realized Profit and Loss (NRPL): Since bitcoin has been consolidating for the last six months some investors are not sure if it has reached a market top. If it has reached a top, its price may fall. However, there is a chance that its value may continue to rise during the remainder of the year. By analyzing the Bitcoin Net Realized Profit and Loss (NPRL) metric we can get a clearer picture of the market situation. Basically, this metric measures the net profit or losses the investors may have realized. If the value is positive it means that the investors have realized net profits. However, if it is negative they have realized net losses.
Despite the recent correction bitcoin has not yet experienced a crash, showing that it has been mainly moving sideways. Nevertheless, the NPRL value has dropped to the level that existed when bitcoin cost around $30,000, when the bull market was just beginning. The following graph shows bitcoin’s NPRL.
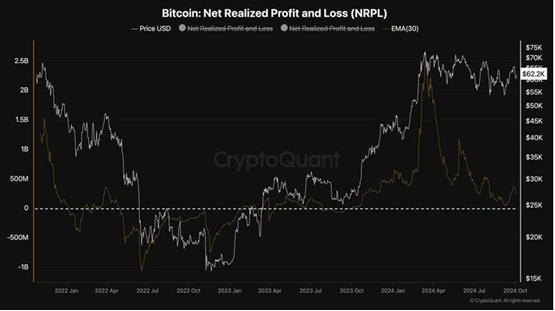
Bitcoin Net Realized Profit and Loss (NRPL) – CryptoQuant
This situation shows that bitcoin may be preparing for a strong upward move. According to CryptoQuant there is a similarity between the current situation and what existed when bitcoin was trading at around $30,000. Thus, there is a high possibility that the bitcoin bull run may continue.
Coinbase Premium Index Indicates a Possibility of a Short-Term Rally: Also, CryptoQuant used the 1-hour chart to analyze bitcoin’s possible price move. It used the daily and weekly moving averages to make its assessment. Historically, if the daily moving average crosses above the weekly one it indicates that the price of the asset may rise soon. At the time that it made the assessment the daily moving average had risen above the weekly one,an indication of a possible bull rally.
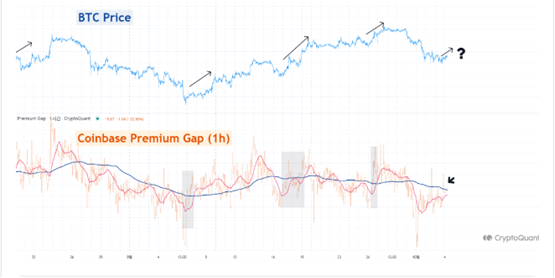
BTC Golden Cross – CryptoQuant
The situation represented by the graph shows that there is a continued demand from US-based investors. This should trigger a short-term recovery in the price of bitcoin which may see its value rising towards $65,000.
According to BlackRock, bitcoin’s 10-day return and 60-day return is usually higher than that of the other investment assets like SPX 500 and gold after the onset of political tensions in some regions.
Bitcoin Price Prediction
Last week the price of bitcoin plummeted by 6% due to the rising tension between Israel and Iran. During the same period there was a fall in institutional demand for ETFs as bitcoin ETFs recorded more than $230 million in outflow. A report from QCP Capital projects shows that if the geopolitical conflict continues the bitcoin price may fall towards $55,000. Also, historical data from BlackRock confirms that geopolitical crises may lead to short-term fall in bitcoin price. However, in the long-term bitcoin is resilient.
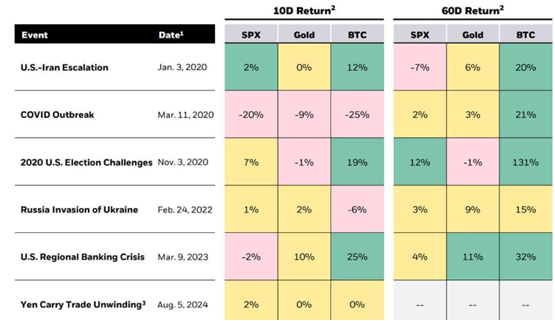
Major Assets Chart During Geopolitical Events – BlackRock
Last week bitcoin entered a descending channel. On several occasions it managed to retest the descending trendline that coincided with the $65,000 price level. If the bitcoin price continues to decline it may reach $55,400, which is close to its 50-weekly Exponential Moving Average at $55,336.
At the time of writing, bitcoin is trading at $63,306 BTC/USDT at Gate.io exchange. Notably, it has registered a 0.3% price increase within the past 1 hour. Although the cryptocurrency is within a horizontal channel on the weekly price chart it is within an uptrend on the daily chart.
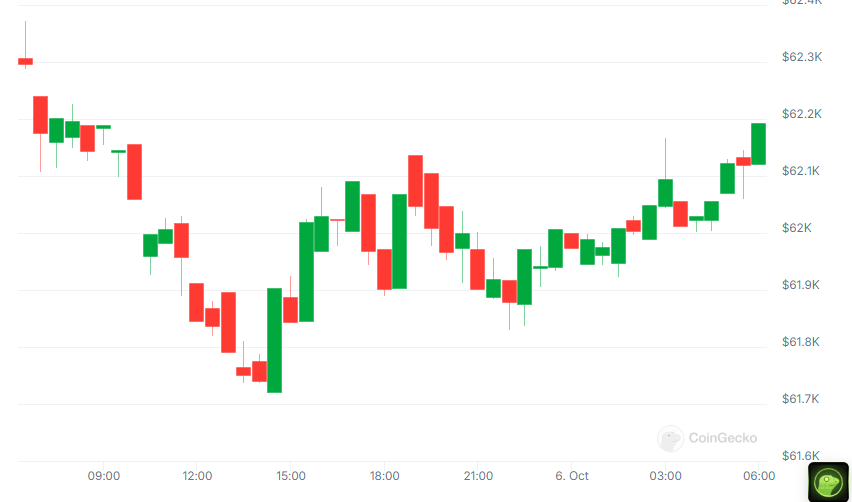
Bitcoin Daily Price Chart – Coingecko
As seen on the chart a momentum candlestick has just emerged from the $62,100 resistance level. This indicates a possibility of another price rise towards the BTC/USDT $65,000 prediction price level. Bitcoin’s closest support levels are at $61,904; $61,887 and $61,721. On the other hand, the nearest resistance levels are at $64,032 and $65,947.