- In the past few months, long-term holders of Bitcoin have continued to hold strong despite the price decline.
- It was found that the majority of holders did not sell their shares because they were in profit on average.
- A year-old supply isn’t being sold by investors.
- There has been an increase of 78% in long-term holder’s supply since low volatility took hold.

As a result of U.S. regulators putting intense pressure on major crypto entities, market participants are experiencing significant FUD. This group of players has little cause to celebrate given May’s prolonged period of low volatility.
What happens if you invest just $100 in Bitcoin (BTC)?
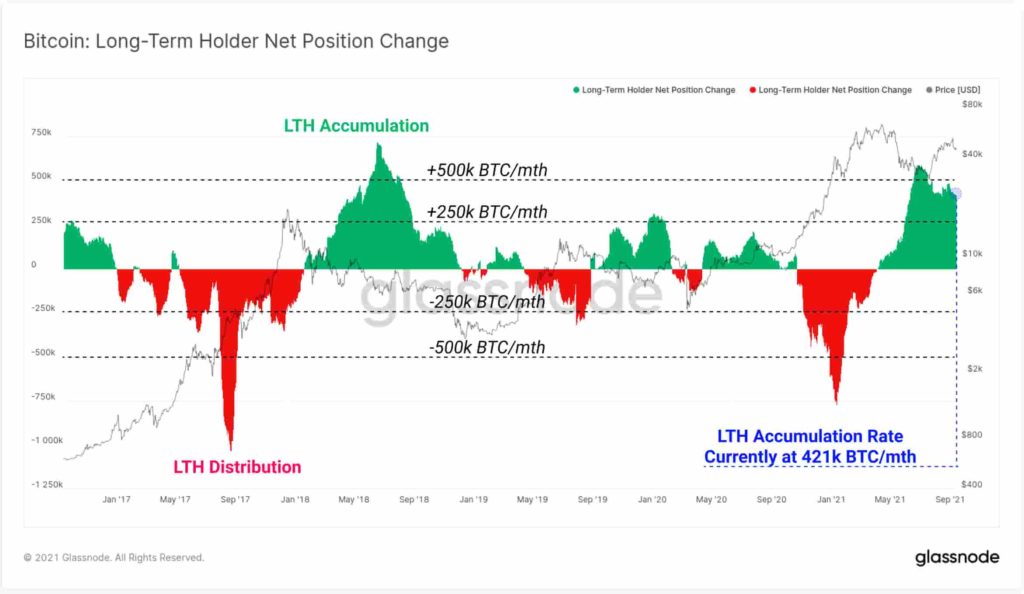
Long-term holders (LTH) remain optimistic despite the odds being stacked against them. Bitcoin [BTC] is an example of this. A report by on-chain analytics firm Glassnode shows that investors remained reluctant to sell their cryptocurrencies despite their value rising for over a year. HODLing behaviour has increased since May 2021, suggesting BTC conviction is still evident despite mild exchange inflows.

A long-term holder (LTH) holds coins beyond 155 days, whereas a short-term holder retains coins for less than 155 days.
Coin holders who hold coins longer than 155 days are termed long-term holders. In general, diamond hands do not sell despite protracted losses, as they have a high-risk tolerance.
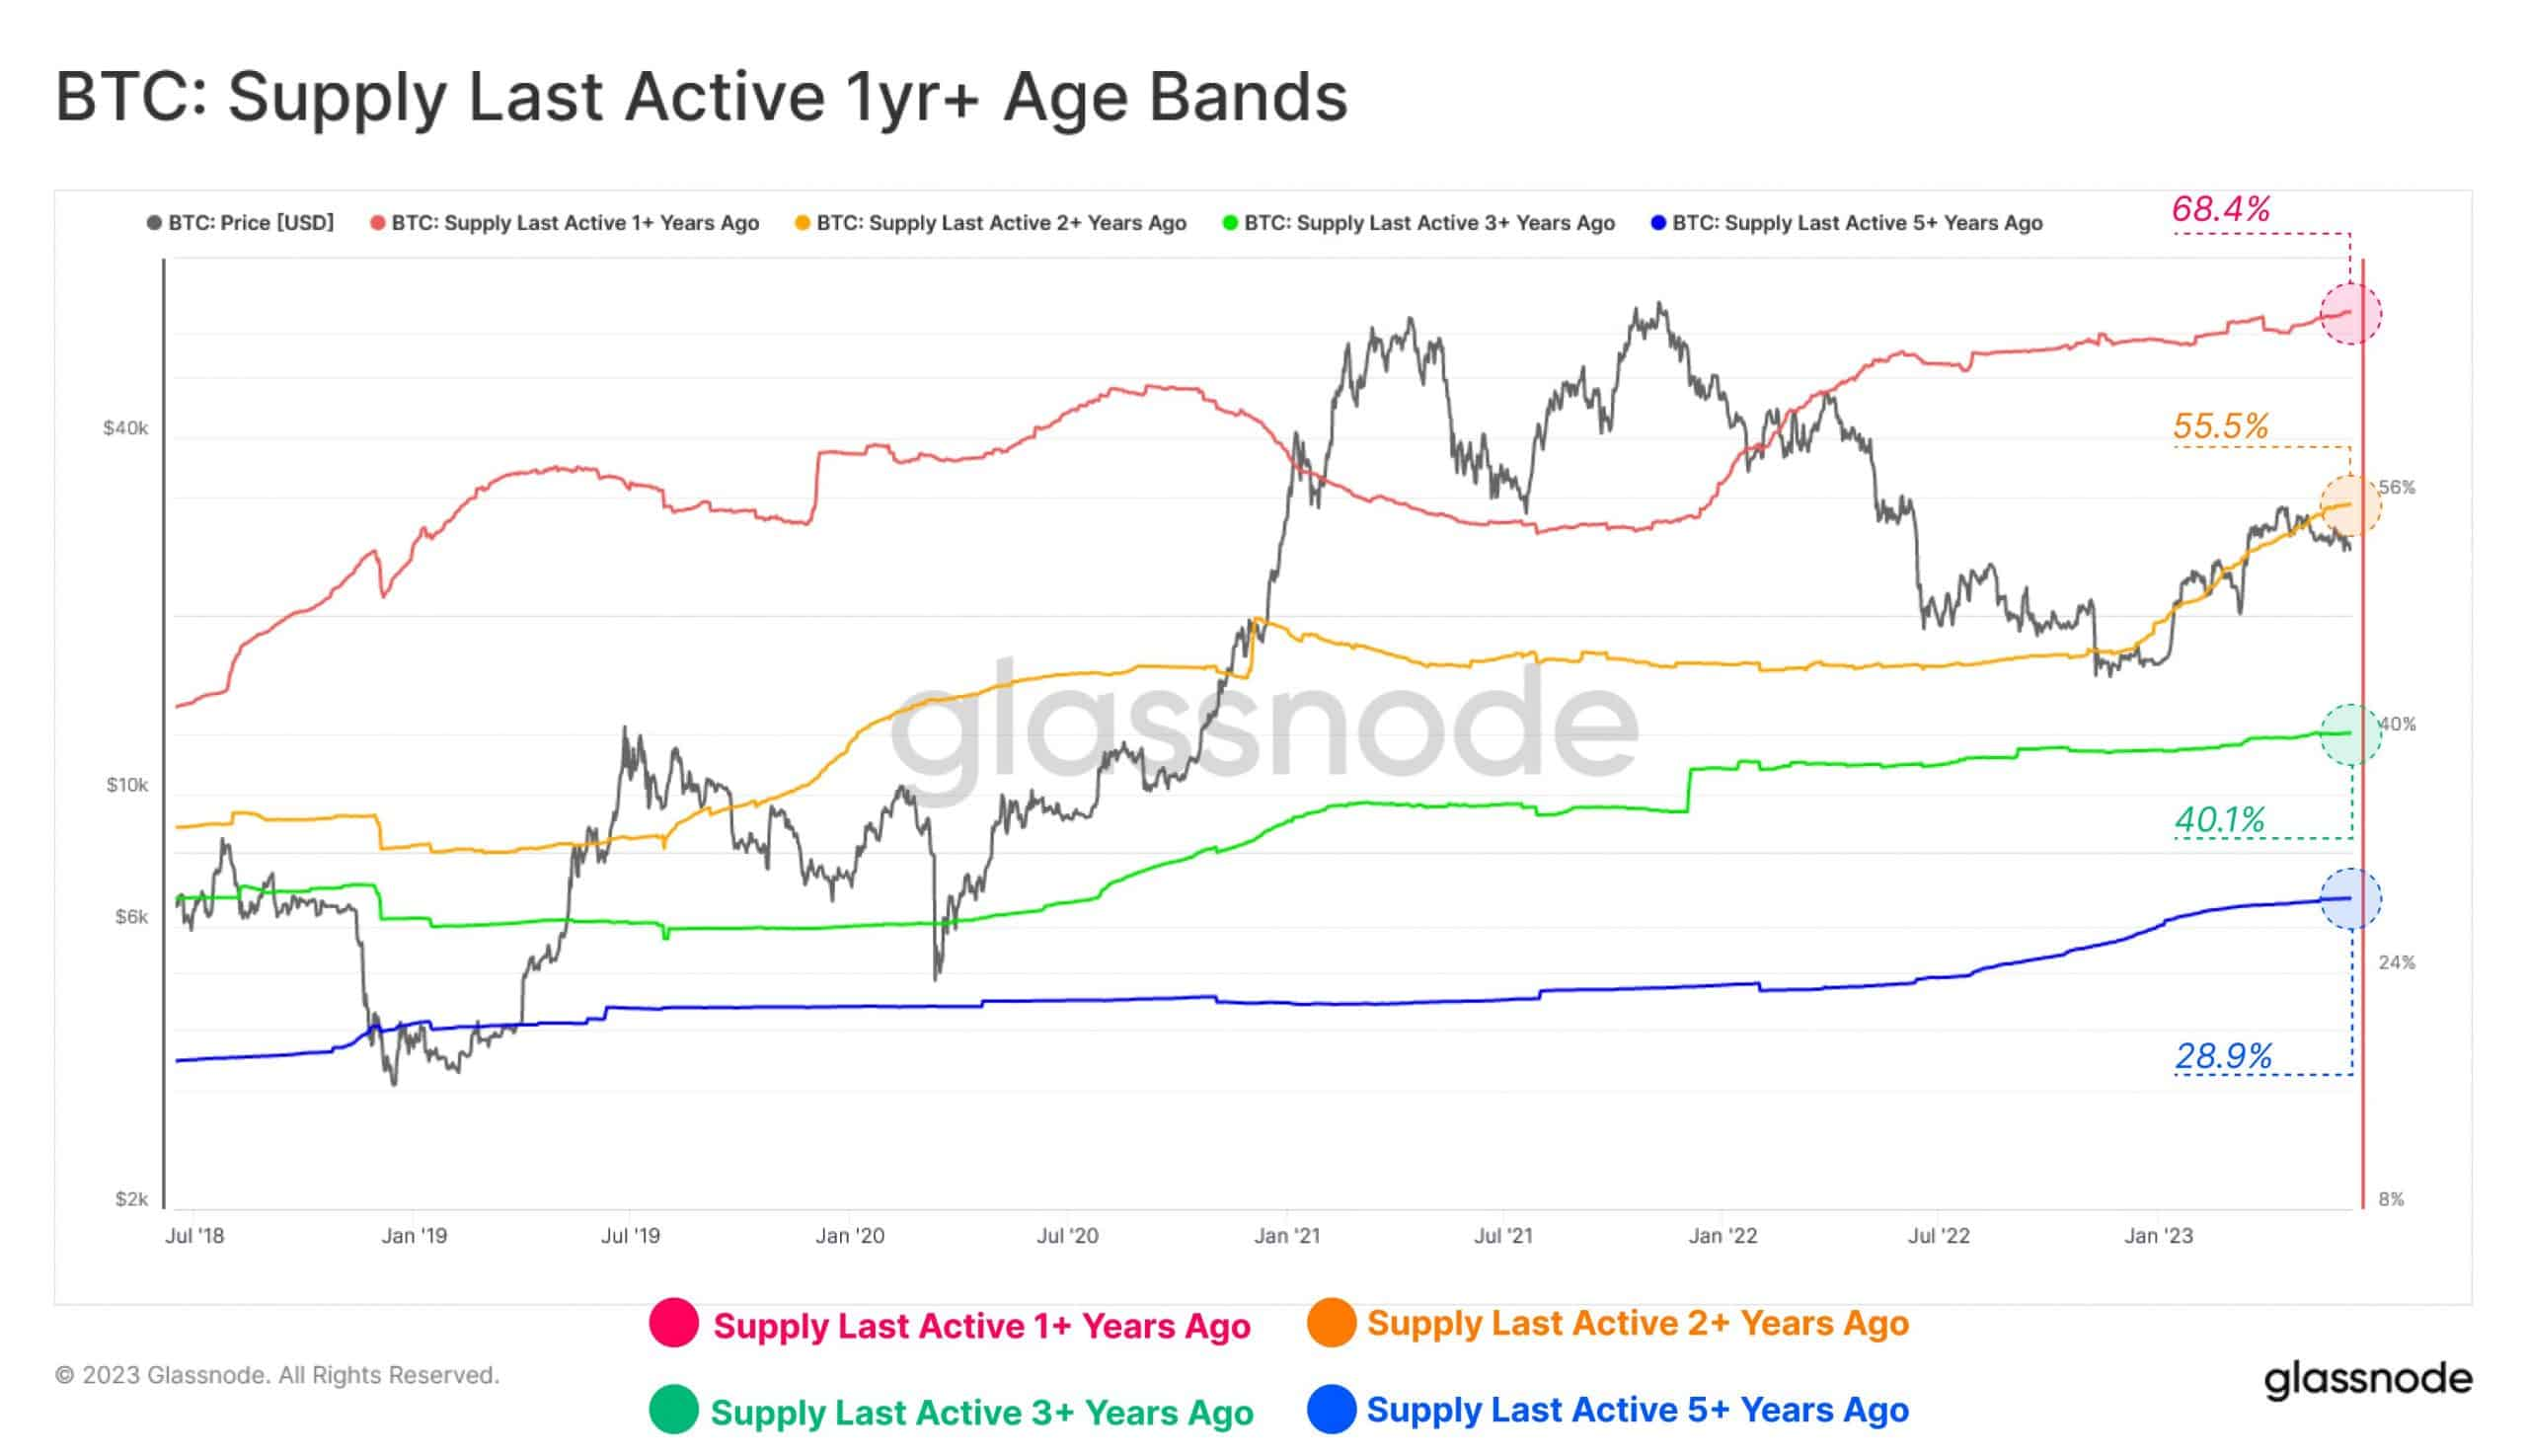
In the above graph, we can see that BTC’s dormant supply has grown significantly since 2023 across most age groups. Supply in the 2+ year band was, however, the most striking trend.
As mining activities moved out of China after the government cracked down and BTC crashed in 2021, this cohort of investors brought the coins with them. Players who hold coins anticipate an upward surge in prices since prices have not recovered.
In spite of this, Bitcoin’s Net Unrealized Profit/Loss indicator gave a reading of 0.23 at the time of publication. There was strong resistance to selling among the majority of holders, which indicated that they were in profit.
Get more profit through the Bitcoin SIP strategy
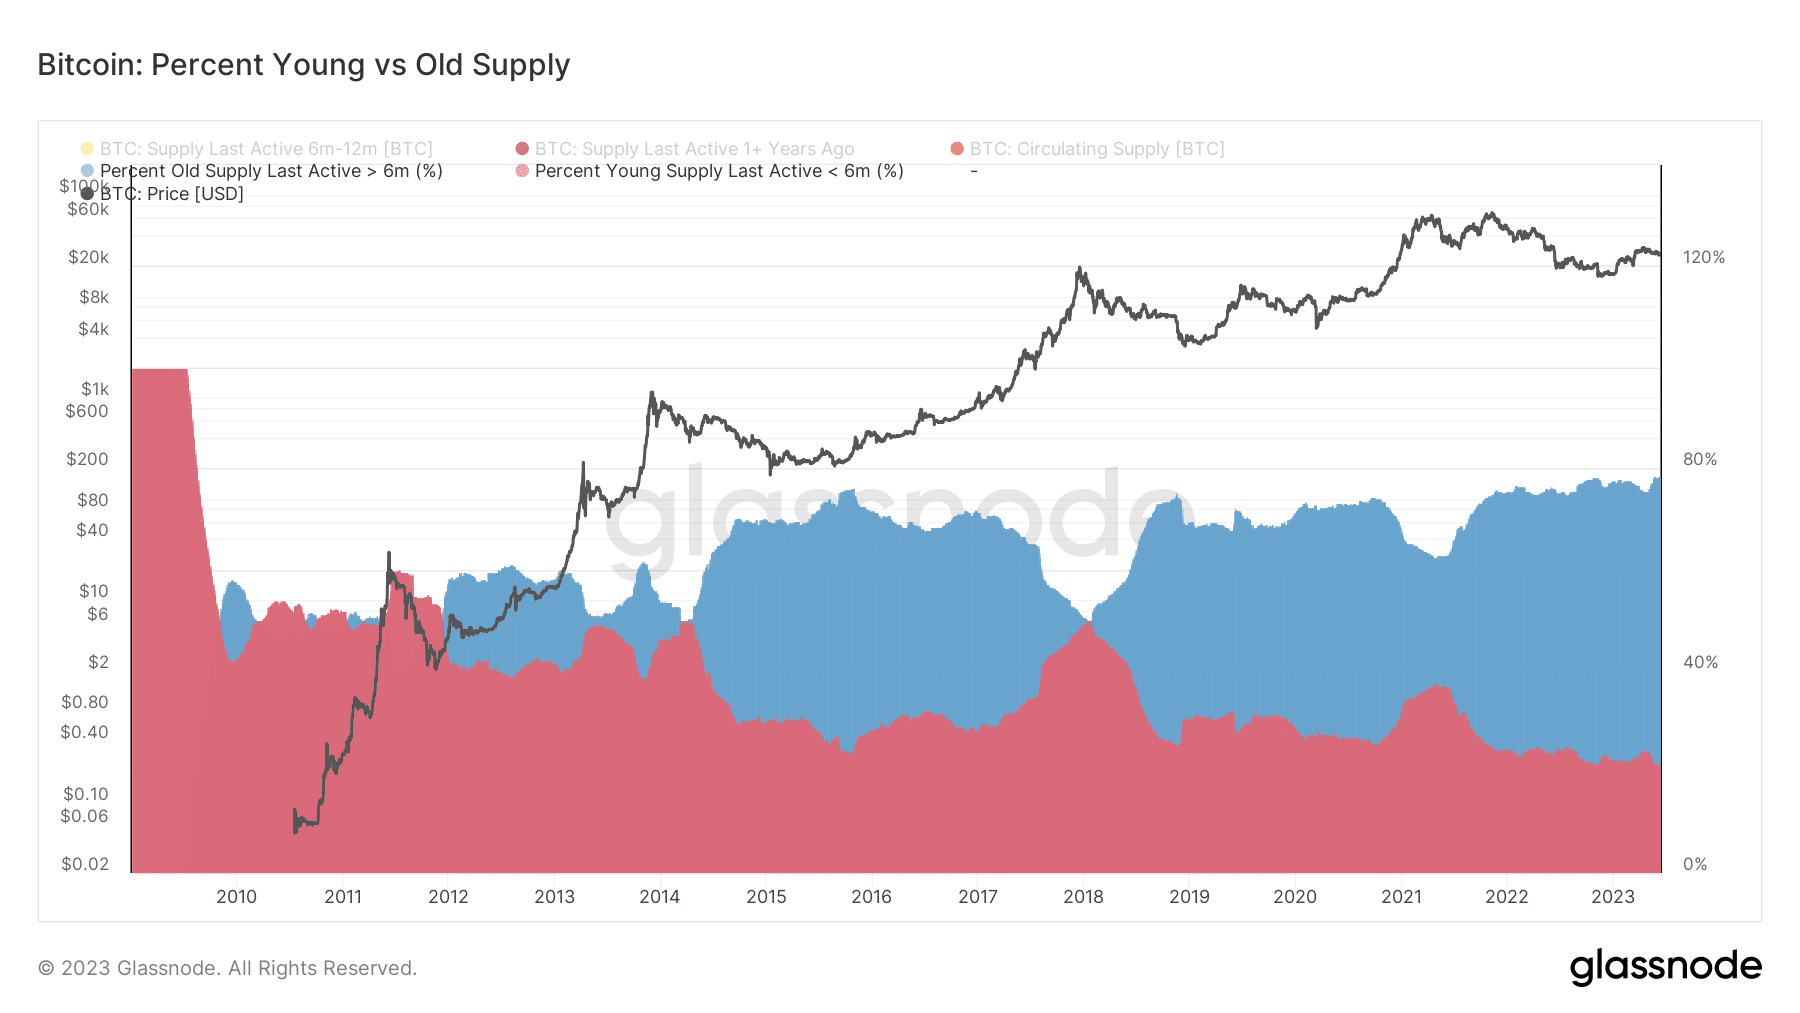
Bitcoin’s supply on a long-term vs. short-term basis

It is also intriguing to compare Bitcoin HODLers who keep tokens for less than 155 days with those who keep them for more than 155 days.
A high-volatility phase has resulted in an increase in LTH supply, which has risen from 75% to 78.62% since the phase kicked in. As a result of their portfolio sales, the STH have sold significant quantities of BTC.
According to CoinMarketCap, BTC was trading at $26,065.66 at the time of publication. There was a reaction to the June 14 Federal Reserve meeting.
While this article was being written, a balance between greed and anxiety prevailed in the market.
Bitcoin Fear and Greed Index is 45 ~ Neutral
Current price: $25,899 pic.twitter.com/zuYJ4pjcEy— Bitcoin Fear and Greed Index (@BitcoinFear) June 13, 2023
According to CoinMarketCap, BTC was trading at $26,065.66 at the time of publication. Market forces looked at the U.S. Fed’s 14 June meeting as a factor that triggered price movements.
Top 11 ways to make passive income with Bitcoin (BTC) in India
Bitcoin Price Prediction for 2023
| Month | Minimum Price | Average Price | Maximum Price |
|---|---|---|---|
| Jan 2023 | $16,524.33 | $20,032.66 | $23,890.27 |
| Feb 2023 | $35,079.27 | $40,926.16 | $45,298.49 |
| Mar 2023 | $37,337.28 | $41,836.66 | $47,947.12 |
| Apr 2023 | $23,998.32 | $52,220.70 | $60,987.59 |
| May 2023 | $24,495.07 | $46,336.74 | $63,419.62 |
| Jun 2023 | $24,800.88 | $26,647.79 | $61,961.56 |
| Jul 2023 | $24,432.28 | $51,937.58 | $62,999.24 |
| Aug 2023 | $24,875.52 | $30,285.09 | $62,021.85 |
| Sep 2023 | $25,796.21 | $37,553.13 | $62,685.24 |
| Oct 2023 | $23,689.35 | $57,511.79 | $61,780.26 |
| Nov 2023 | $25,381.28 | $28,743.47 | $63,153.58 |
| Dec 2023 | $23,678.22 | $37,479.32 | $61,878.65 |
Bitcoin Price Prediction – 2024, 2025, 2026, 2027, 2028, 2029, 2030
| Month | Minimum Price | Average Price | Maximum Price |
|---|---|---|---|
| 2024 | $61,914.38 | $70,042.60 | $74,378.34 |
| 2025 | $85,056.02 | $100,365.80 | $104,845.93 |
| 2026 | $111,023.78 | $125,833.20 | $132,360.64 |
| 2027 | $111,023.78 | $125,833.20 | $132,360.64 |
| 2028 | $136,965.34 | $155,778.08 | $158,451.89 |
| 2029 | $194,611.0 | $210,212.60 | $216,102.66 |
| 2030 | $281,116.06 | $297,197.79 | $301,302.08 |
